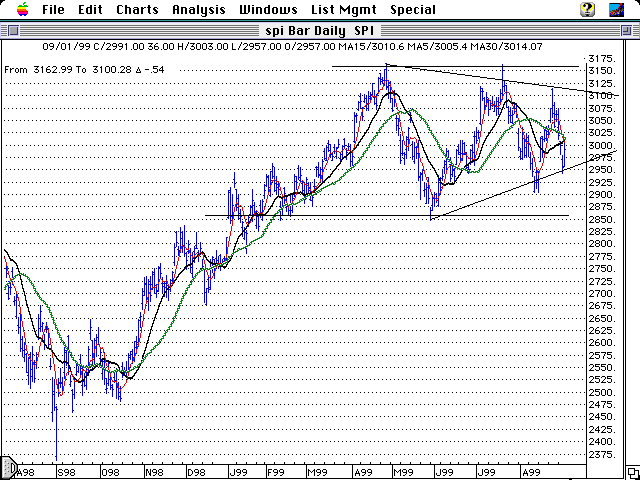
For most of this calender year, our market has traded sideways. This has
been the tightest trading range for any year this decade. Note the all
time high on April 28 is yet to be taken out as at September. The EIS
forecast more than four years ago was for an all time high in the first
quarter of this year. Will the April top hold this year ?
Observe the triangle now forming on the spi. Our market is displaying
currently an epic battle of the bulls versus the bears. One side will win
out shortly. My reading of the market shows this pattern to be quite a
large distribution going on; ie a major topping formation. If the triangle
breaks on the downside, look out.
Take particular note of this years high and low dates.
High, April 28 at 3165, 247 days from 31st December 1999 (240 degrees solar
time)
Low, May 28th at 2848, 217 days from 31st December.
We have what looks like another important turn August 31st, (120 solar
degrees from Dec 31st). Most other major commodity markets are turning on
similar dates. Believe it or not, this is telling us that the millennium
change date of Dec 31 will be significant. (It is not suggesting this will
be good or bad, merely a date of significance.)
Watch also the days around Sept 24th, equinox, and the last few days of
October this year. These times should prove significant as to major world
events of some importance. Let's see what happens.

