| PBL 1/5/00
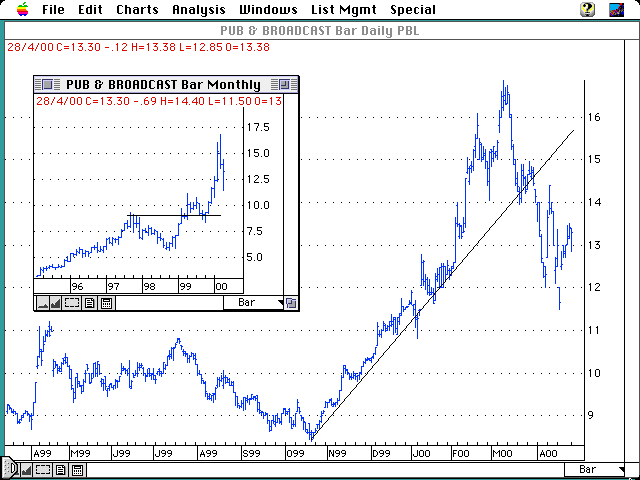
Concentrating on the recent run down from $16.87 March 8 to $11.50 April
17, this occurred in 3 legs, as a good Elliott wave pattern: 292 (1687 -
1395) 295 (1495 - 1200) then 290 (1440 - 1150) (with a higher low / lower
top in between this 3rd leg. (most unhelpful) We had a whole weekend to
observe that Monday 17th April the market was going to open up weak and at
lower levels. PBL around $11.75 on this day presents a trading opportunity
if you are aware of past ranges, with appropriate stop loss and risk
management rules.
That low on the 17th is called an island reversal. Of course you don't get
confirmation until the market action of the following day. That is a
strong bar reversal and could be expected to hold for thirty to sixty days
minimum for at least a minor reversal of trend. I would expect PBL to at
least move slowly back to the mid point of the larger rundown, $14.18, this
month, before making its next move. If $11.50 breaks we are in a bear
market.
PBL topped out on march 8, this is 2 days before Nasdaq on March 10. As
Gann says, a leading stock therefore one to watch for assistance in
forecasting the movement of other stocks. PBL is moving first.
There is also a head and shoulders at the top too. Lows at $14.00, left
shoulder $16.00, right shoulder $15.00, (therefore sloping shoulders). A
reversal pattern that rarely breaks in the short term. The completion of
the head and shoulder pattern, the same time as the trend line broke, gave
early warning of a further move down. Such trend lines are always marked
on my chart as they form, extended out into the future on the chart itself.


 Home ----- Contact Us

|
