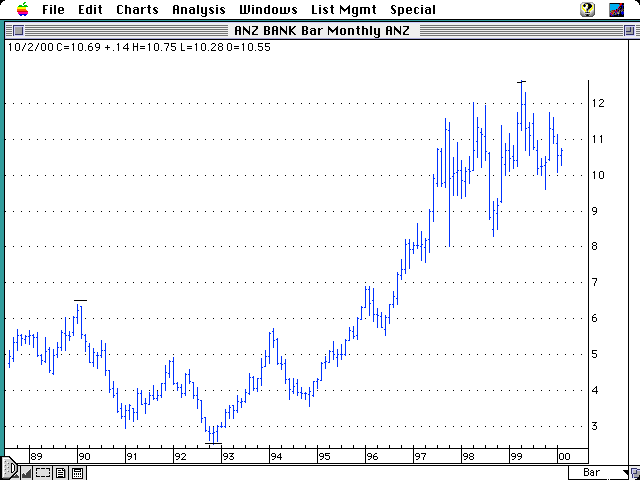
| ANZ 10/2/00
ANZ, as you may remember from the charting classes, has a great Fibonacci
track record. Check this one out.
Best results come off major changes in trend - ie good tops and bottoms.
1990 high 636, 1992 low 249 = range of 387.
(387 * 2.618) + 249 = 1262.
1999 top was 1266.
I know several traders who worked this out well in advance during the
1996/97 run, successfully traded.
Note also the majority of tops/bottoms occurred in January/February.


 Home ----- Contact Us

|
