 Sanford Securities December 2000
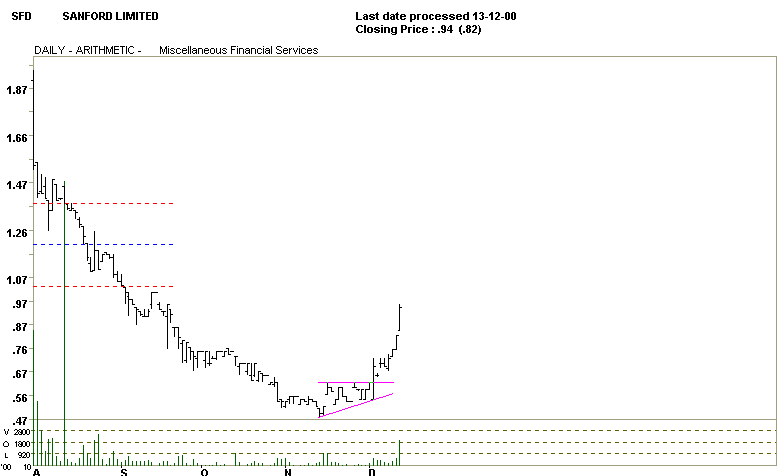
Attached is a daily chart of Sanford Securities which listed on the ASX
back on 1st August. A strong downtrend has been evident for this stock
until it bottomed on 14th November at 47 cents. The stock moved sideways
for a time and met resistance at 62 cents. Notice then the development of
an ascending triangle which when broken over 62 cents, moved strongly up
into a new uptrend. Target on this now is the fibonacci level of $1.02 but
it may be better to get out around 98/99 cents. Virtual trading room
subscribers knew of this stock and others in advance and therefore should
have been in a good position to make a good trade on this stock.


 Home ----- Contact Us

|
