| Moving Averages 4/7/00
Moving averages
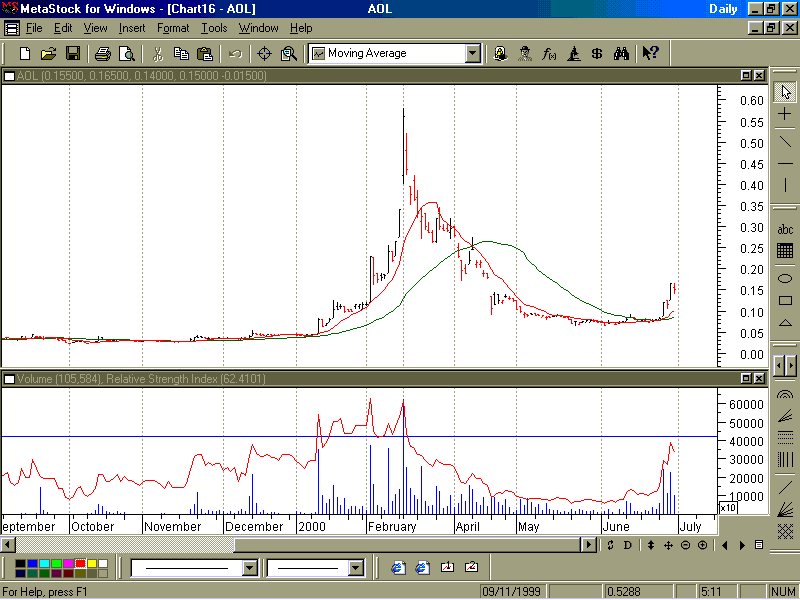
Above is the chart of AOL. Of interest is the pattern that has formed with
the moving averages. The moving averages displayed are the 10 day (in red)
and the 34 day (in green). When the 10 day, or shorter term,
moving average crosses above the 34 day, or longer term, moving average,
this is known as a crossing. A crossing is generally a good indicator of a
change in trend but this can depend on the time frames you use with these
moving averages. Of particular interest is a golden crossing. This is where
the short term MA crosses above the long term MA and the long term MA is
also in an uptrend.
I have listed a number of stocks which show strong crossings at least where
the 34 day MA is going sideways or better. This list is not exhaustive and I
have noticed a lot of crossings over the last month. Here are the stocks:-
SNX, AMM, QTK, MBP, DNI, PRI, SAS, MUL, SEN, UCL, TNY, IHY, PRE, BDL, AML,
NRT, CIR, FHL, PWR, TMN.


 Home ----- Contact Us
|