The chart of course is useful to help better time your purchase, by
applying a few simple charting rules, as taught in our charting classes.
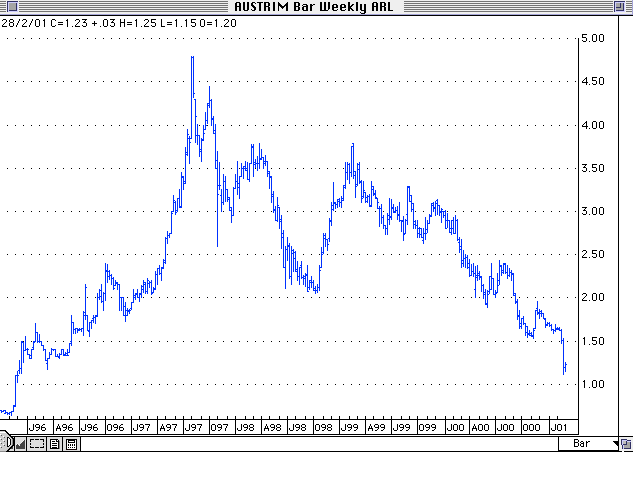
Such simple rules can be applied to say Austrim, ARL.
A review of the
chart shows a clear down trend, lower tops and lower lows for the past
year. Once the stock broke below the major $2 low in August, that is even
worse, and shows clearly you can forecast bad news is coming for the stock.
(Application of Gann theory may even help you determine the date this news
might be released - and yes this is possible to do).
By this time you
could have put a trend line on this movement - I never buy a stock below
such a down trend line unless I have a damn good time reason for doing so.
(Taught in our Gann classes).
You would also have a moving average or two
drawn - I don't buy stocks below a moving average, because the momentum is
down. Pretty simple I reckon, though the psychology and discipline
required to put this into practice must be learned, sometimes through very
bitter experience.
The number of students I observe trying to pick lows,
continually astonishes me. I am far better off trying to buy retracement
lows in a stock like Peptech, than the lows of Austrim. Pretty simple
really, but how many of us actually do this ?
