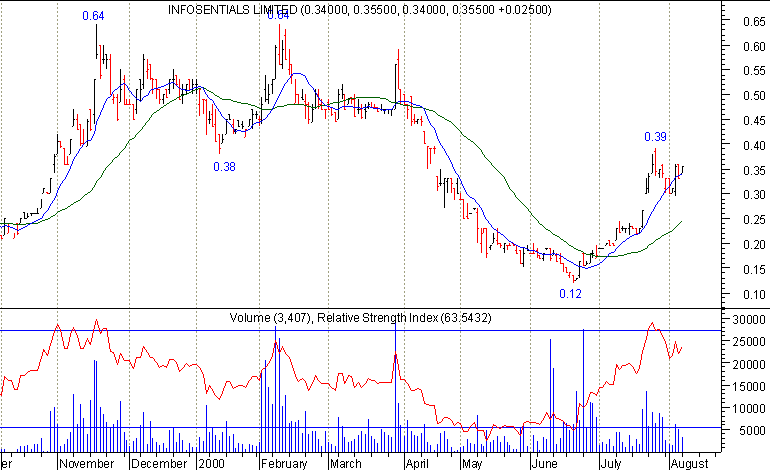
Attached is the chart of Infosentials Ltd, showing all the classic signs and
indicators any budding chartist could ask for !! First notice the double top
of 64 cents back on the 17/11 and again on the 9/2 clearly indicating that a
retracement was due. Well then now that you have the next trend sorted out,
how far do you think the stock would retrace to ? Well in between the double
tops, the stock bottomed at 38 cents on the 13/1/2000, a range of 26 cents.
Using the old double top/bottom rule of 200% of the range, this calculates
out at 52 cents ie. 26 cents x 200%. So using this as our target the stock
would stop at 12 cents ie. 64 cents - 52 cents. Well the stock bottomed
exactly at 12 cents on the 21/6.
At this stage you could have wondered where the stock was going to next and
again what the target price will be. It is a fair bet that after the stock
has reached the 200% range from the double top and is at such low levels
that the trend is ready to change. You got absolute confirmation of this in
early July, when the price was at about 19/20 cents. Notice here how the
moving averages crossed over. Another classic sign. So where to from there ?
Well calculating the range down is 52 cents, from our calculations above,
then 50% of this range is 26 cents, giving a midpoint of 38 cents, (12 +
26). Where did the stock end up at ? 39 cents on the 26 July. Also note how
this is also the bottom of the stock on the 13/1 as mentioned above. Amazing
stuff really.
In my opinion you can't ask for any better indicators than that have come
out on this stock. With such an interesting stock, I would keep a close eye
on this one as to the next possible movement. If it breaks above the
midpoint, calculate the next point of resistance possibly 45 cents or else
it could go to previous highs at 60/64 cents.

