| Amrad
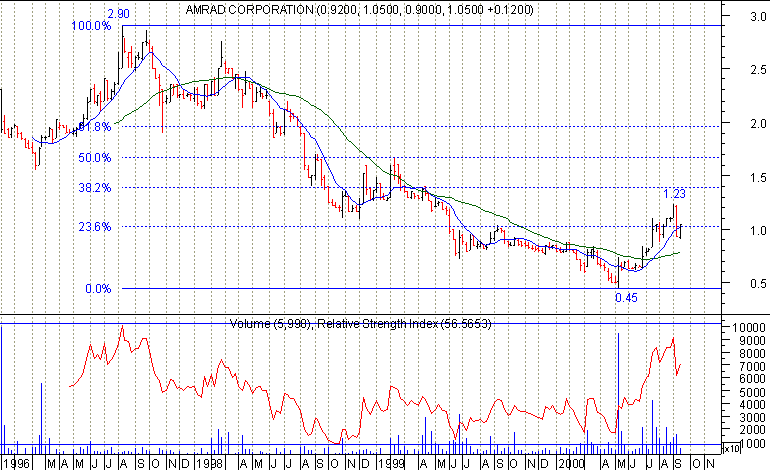
Weekly chart of Amrad showing the stock has clearly changed trend (higher
tops and bottoms). Also notice the cross over on the moving averages and
the
Relative Strength Index which double bottomed at around the bottom of 45
cents in May this year. First point of resistance the 38.2% fibonacci
target
of $1.38 and then $1.67 midpoint.


 Home ----- Contact Us

|
